Organic search, free Shopping listings and direct visits now bring in nearly two of every three shoppers, and the ad bill is a quarter of what it was.
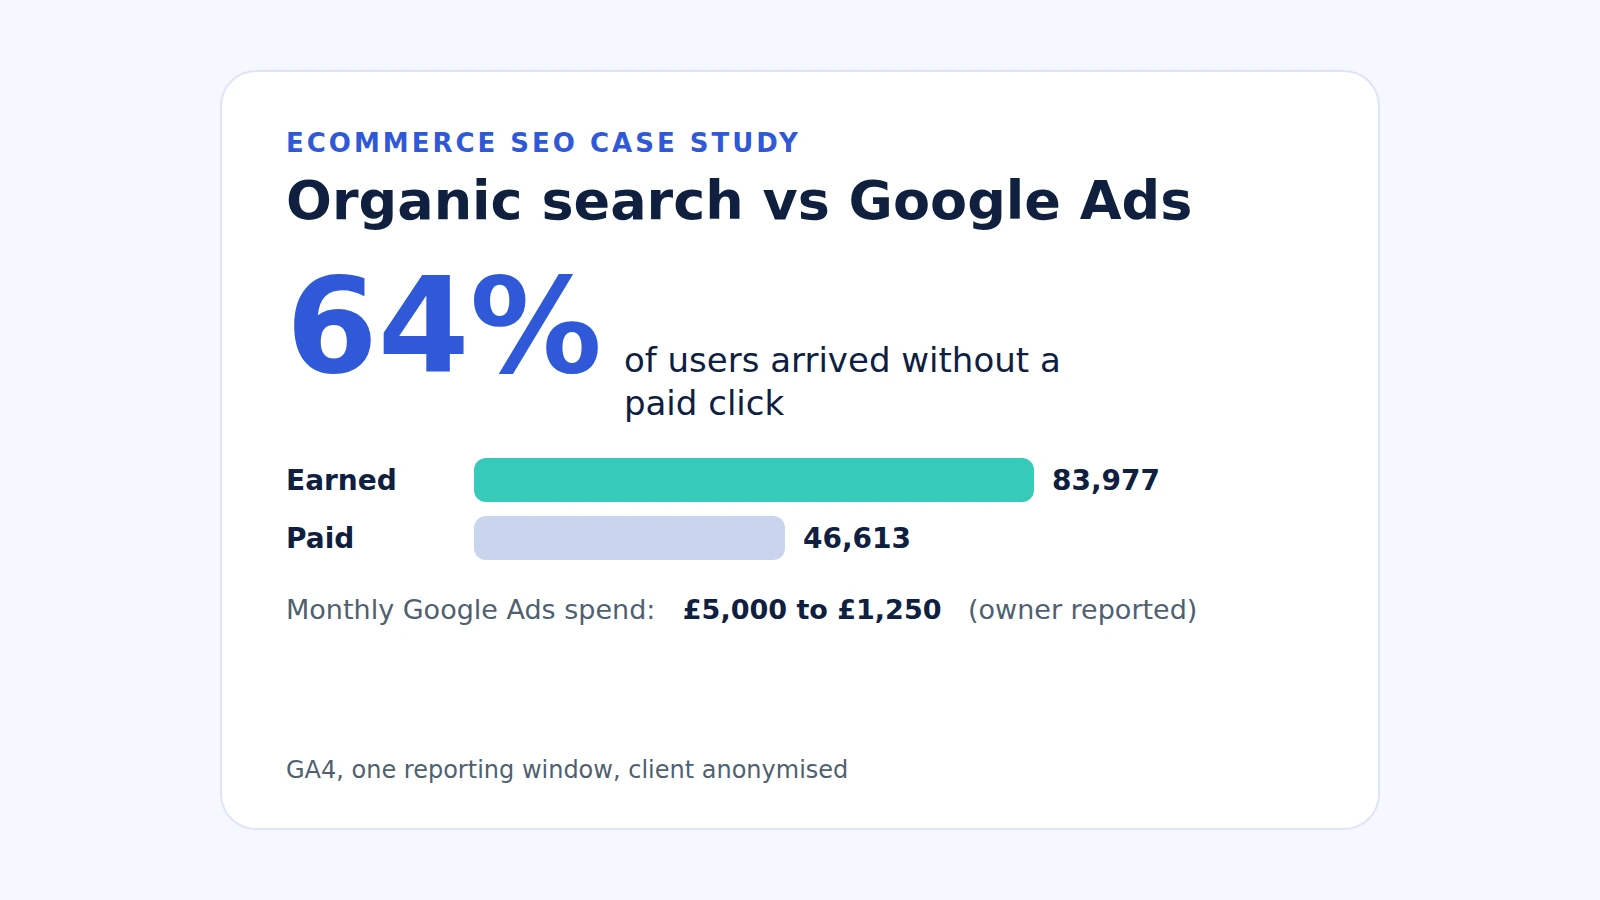
Organic search can carry an online store, and this one proves it: in a single Google Analytics 4 reporting window, 83,977 of the store’s 131,550 users (64%) arrived without a paid click. The store is a UK bathroom retailer on Shopify, selling showers and saunas to homeowners who want a spa-style shower and sauna space at home. The owner came to us spending about £5,000 a month on Google Ads. Six months into the engagement the owner reports spending about £1,250 a month, a cut of 75%, while unpaid channels now bring in at least £182,994 of the revenue in the same window. This case study shows the five GA4 screenshots behind those figures, turns them into pictures you can read at a glance, explains exactly how we split earned traffic from paid traffic, and walks through the semantic SEO method that built the organic side. Nothing is rounded up. The client is anonymised at their request, so page names in the screenshots are blurred. True SEO Consultants Ltd publishes only what those screenshots support, and every figure the owner supplied is labelled as the owner’s.
- 64%of users arrived without a paid click
- 5.5xOrganic Search users against Paid Search and Paid Shopping
- 4.81%Organic Shopping key event rate, against 0.61% on Paid Shopping
- 75%cut in monthly Google Ads spend, owner reported
Key takeaways
- 64% of users came from earned channels. Organic Search, Organic Shopping, Organic Social and Direct brought in 83,977 of 131,550 users.
- Organic Search alone brought in 5.5 times the users of Paid Search and Paid Shopping combined: 31,051 against 5,674.
- Organic visitors take action more often. Organic Search sessions hit a key event at 2.6% and Organic Shopping at 4.81%, against 0.61% for Paid Shopping.
- Earned channels out-earn paid ones. At least £182,994 of revenue came from earned channels in the rows shown, against £168,688 from paid rows.
- The ad budget fell by three quarters. The owner reports cutting Google Ads from about £5,000 to about £1,250 a month.
- The saving pays for the SEO. The owner reports that the £3,750 a month no longer spent on ads roughly covers the retainer, which sits at about 1% of annual turnover.
- Paid still has a job. Cross-network, the Google Ads channel that includes Performance Max, remains the store’s largest single revenue row, so the win came from rebalancing spend, not switching it off.
The results at a glance
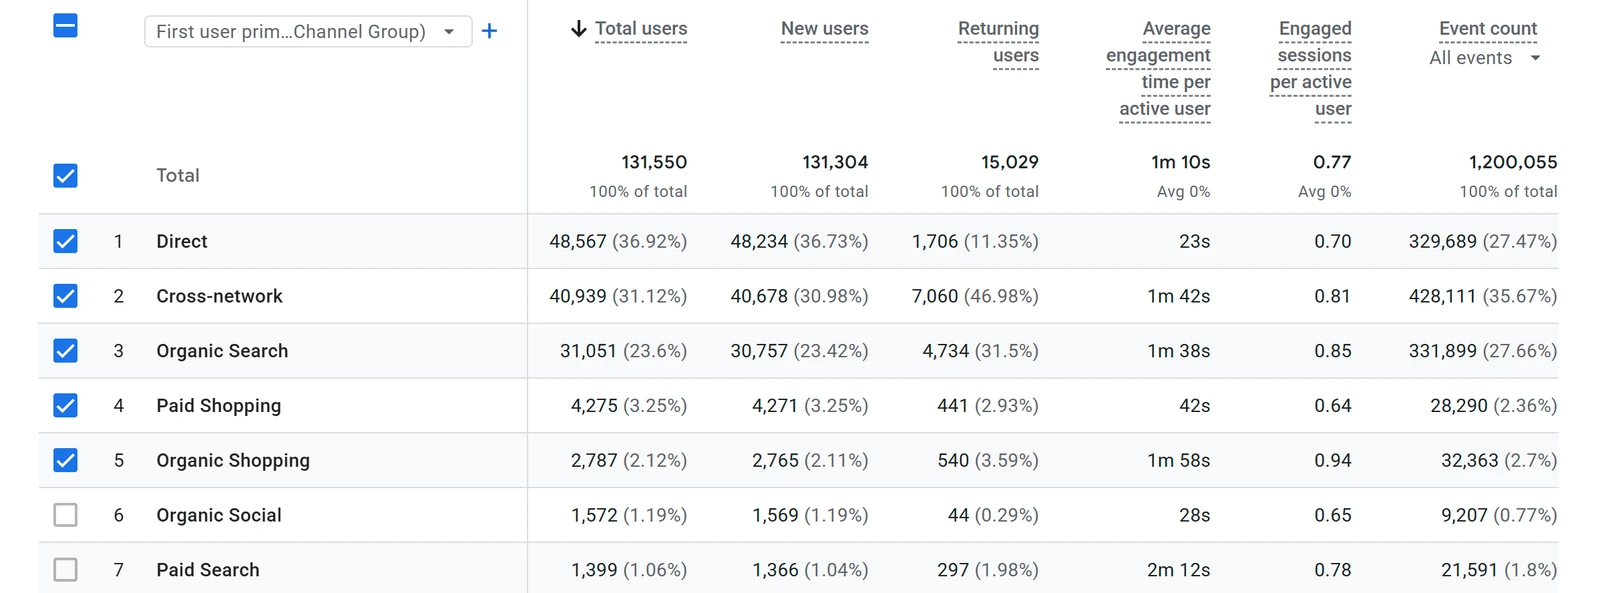
The store’s earned channels brought in 64% of users and at least 46% of revenue, measured in one GA4 window with the same totals across every report. The picture below shows, channel by channel, what each source is, how many people it brought and what they spent.
Where 131,550 shoppers came from
One GA4 window. Teal means no click fee. Blue means Google Ads paid for the visit.
People
Money
Nearly 2 in 3 visitors cost nothing per click. The grey 11% is revenue from rows the report did not show.
Earned: no fee per click
Organic Search
Found the store in Google’s normal results
31,051 people
£93,242 revenue 2.60% take a key action
Organic Shopping
Clicked a free product listing in Google Shopping
2,787 people
£20,317 revenue 4.81% take a key action
Organic Social
Came from an unpaid social post or profile
1,572 people
revenue not in view
Direct
Typed the address, used a bookmark or tapped through from an app
48,567 people
£69,434 revenue 1.33% take a key action
Paid: Google Ads
Cross-network
Performance Max and Demand Gen ads across Google
40,939 people
£167,148 revenue 2.06% take a key action
Paid Shopping
Clicked a sponsored Shopping ad
4,275 people
£1,539 revenue 0.61% take a key action
Paid Search
Clicked a text ad above the results
1,399 people
revenue not in view
Source: the store’s GA4, User acquisition (first user channel) for people, Traffic acquisition (session channel) for revenue and key event rate. Same reporting window.
See these numbers as a table
| Channel | Type | Users (first user channel) | Revenue (session channel) | Key event rate |
|---|---|---|---|---|
| Direct | Earned, unattributed | 48,567 | £69,434.47 | 1.33% |
| Organic Search | Earned | 31,051 | £93,242.49 | 2.60% |
| Organic Shopping | Earned | 2,787 | £20,317.28 | 4.81% |
| Organic Social | Earned | 1,572 | not shown | not shown |
| Cross-network (Performance Max, Demand Gen) | Paid | 40,939 | £167,148.34 | 2.06% |
| Paid Shopping | Paid | 4,275 | £1,539.29 | 0.61% |
| Paid Search | Paid | 1,399 | not shown | not shown |
| Earned total | 83,977 (64%) | £182,994.24 | ||
| Paid total | 46,613 (35%) | £168,687.63 | ||
| Other channels | 960 (1%) | £43,391.46 |
Two channels show no revenue figure because the session report on screen stopped after five rows. The £43,391 of revenue those hidden rows carry sits in neither total, so both totals are floors, not ceilings.
The first user report is the fairest place to judge acquisition, because it credits each person to the channel that first brought them to the store. On that report Organic Search is the third largest source of users, ahead of every paid row except Cross-network.
What counts as earned traffic and what counts as paid in GA4?
Earned traffic is any visit the store did not pay a click for, and paid traffic is any visit that came from an ad. In GA4 the paid side is Paid Search, Paid Shopping and Cross-network, and we count all three as paid on this page, whatever the label says.
Cross-network is the row that catches people out. The Google Analytics default channel group definitions place Google Ads traffic from the Cross-network and Google owned channels network types in this group, and name Performance Max and Demand Gen among the campaigns it covers. It carries no “Paid” label, yet it is paid. Calling it organic would flatter the story and mislead anyone who reads the screenshot properly, so it stays in the paid total, even though moving it would have made our numbers look far bigger.
Why Direct sits with earned traffic
Direct sits with earned traffic because nobody paid for the click, and because it is where GA4 files visits it cannot trace. The same Google Analytics definitions class a session as Direct when the source is “(direct)” and the medium is “(none)” or “(not set)”: typed addresses, bookmarks, links in some email apps, and links opened from apps that strip the referrer.
Several AI assistant apps behave that way. A homeowner who asks an assistant which walk-in shower suits a small bathroom, then taps the store’s name, can land as Direct rather than as a referral, which is why AI and LLM citations go largely untracked in GA4. We say that openly rather than hiding it inside a bigger organic number.
Direct is not pure organic either. Some of those 48,567 people will have met the store through an ad weeks earlier and come back by typing its name. We label the row “earned, unattributed” for that reason, and the organic claims below stand on Organic Search and Organic Shopping alone.
A note on the £2.93 million in the audience report
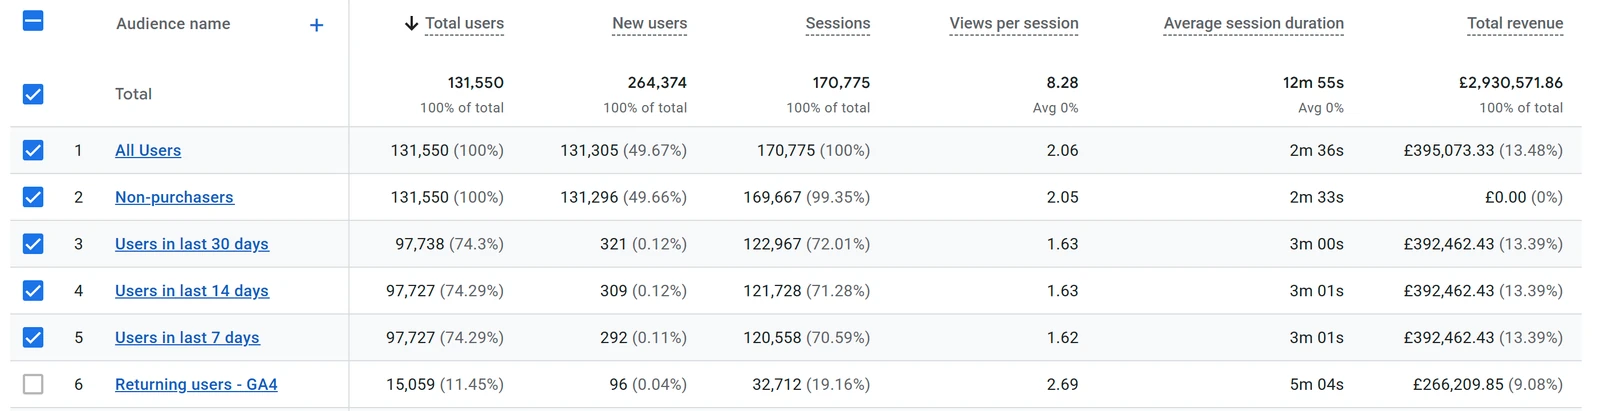
The audience screenshot shows £2,930,571.86 in its top row, and that figure is not revenue. GA4 adds up every audience listed, and the audiences overlap, so the same sale is counted several times. The real revenue for the window is the “All Users” row, £395,073.33, which matches the channel report exactly, down to the pence.
Do organic visitors convert better than paid visitors?
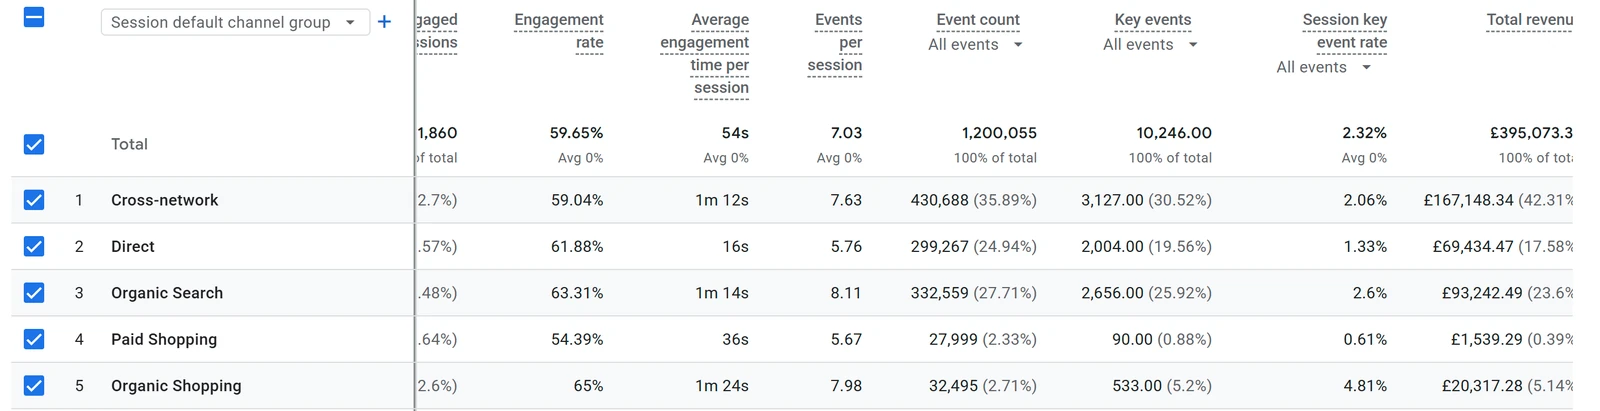
Yes: organic visitors take a key action at four to eight times the rate of the store’s paid Shopping visitors. Organic Search sessions reached a key event 2.6% of the time and Organic Shopping sessions 4.81% of the time, against 0.61% for Paid Shopping.
Who takes action once they arrive?
Each dot is 2 key actions per 1,000 visits. Ranked best to worst from the session channel report.
- 1
Organic Shopping earned
48 key actions per 1,000 visits
- 65.00%engaged
- 1m 24sengaged time
- 7.98events a visit
Best buyers on the site
- 2
Organic Search earned
26 key actions per 1,000 visits
- 63.31%engaged
- 1m 14sengaged time
- 8.11events a visit
Busiest browsers: 8.11 actions a visit
- 3
Cross-network paid
21 key actions per 1,000 visits
- 59.04%engaged
- 1m 12sengaged time
- 7.63events a visit
Strong, but every click is paid
- 4
Direct earned
13 key actions per 1,000 visits
- 61.88%engaged
- 16sengaged time
- 5.76events a visit
Short visits from people who know the way
- 5
Paid Shopping paid
6 key actions per 1,000 visits
- 54.39%engaged
- 36sengaged time
- 5.67events a visit
Plenty of clicks, few actions
Source: the store’s GA4 Traffic acquisition report, session primary channel group. Key actions per 1,000 visits worked out from each key event rate.
See these numbers as a table
| Session channel | Engagement rate | Engagement time per session | Events per session | Key event rate |
|---|---|---|---|---|
| Organic Shopping | 65.00% | 1m 24s | 7.98 | 4.81% |
| Organic Search | 63.31% | 1m 14s | 8.11 | 2.60% |
| Cross-network | 59.04% | 1m 12s | 7.63 | 2.06% |
| Direct | 61.88% | 16s | 5.76 | 1.33% |
| Paid Shopping | 54.39% | 36s | 5.67 | 0.61% |
Organic Search also beats Cross-network on key event rate, 2.6% against 2.06%, which is 26% higher. The gap comes from intent. A homeowner who scrolls past the ads and chooses an organic listing for a walk-in shower or a home sauna has usually measured the space and compared options already. In our experience, a Shopping ad more often reaches someone still browsing.
Here is what that means in actions. For every 1,000 sessions, Organic Search delivers about 26 key events and Organic Shopping about 48, while Paid Shopping delivers about 6. Each of those paid sessions also costs money, while the organic ones cost nothing at the point of the click.
SEO vs Google Ads: how the two compare for an online store
SEO earns visits that cost nothing per click once a page ranks, while Google Ads buys visits that stop the day the budget stops. For this store the practical difference showed up in three places: cost per visit, how the visits behaved, and what was left when spend fell.
SEO vs Google Ads, for this store
The general trade off on the top rows, this store’s own GA4 numbers on the bottom two.
SEO
Google Ads
How you pay
Content and fixes up front, no fee per click
A fee on every click, every day
How fast it starts
Months, while pages earn their rankings
Traffic from the day the campaign goes live
When spending stops
Pages keep ranking while they stay useful
Paid traffic stops with the budget
Where it shows
Organic results and free Shopping listings
Sponsored slots, Shopping ads, Performance Max
Key action rate in this store
Organic Search 2.60%, Organic Shopping 4.81%
Cross-network 2.06%, Paid Shopping 0.61%
Best job in this store
Planning and comparison searches for showers and saunas
Launches, seasonal lines and new audiences
Source for the store rows: GA4 session channel report. Upper rows describe how each channel works.
Why the two work better together
The two channels feed each other, which is why this store rebalanced rather than switched Ads off. Google Ads Help lists landing page experience as one of the three components of Quality Score, alongside expected clickthrough rate and ad relevance, and defines it as how relevant and useful the landing page is to people who click the ad. The same category and product pages we rebuilt for organic search are the pages the ads land on, so the SEO work also improved the pages the remaining ad budget pays to send people to.
How did the store cut its Google Ads budget by 75%?
The store cut its ad budget by moving money away from searches it now wins organically, not by switching campaigns off. The owner reports that monthly Google Ads spend fell from about £5,000 to about £1,250 over the six months, and that sales held up.
We ran the reallocation in three passes, and each pass waited for the organic rankings to hold first:
- Overlap check. We matched the paid search terms report against Search Console and listed every product and category query where the store already ranked in the top three organically.
- Budget pull. Paid bids on those overlapping queries were reduced first, because the store was paying for clicks it would largely have received for free.
- Keep what only paid can do. Budget stayed on new product launches, seasonal lines and the Cross-network campaigns such as Performance Max, which still find buyers the organic pages have not yet reached.
That third pass is why Cross-network is still the largest single revenue row. A trimmed, better aimed Cross-network budget is part of the result, and we would not hide it.
Why the SEO retainer costs the owner nothing extra
The owner reports that the retainer is set at roughly 1% of the store’s annual turnover, and that the £3,750 a month released from the ad budget covers it. Put simply, the SEO is funded from money the owner was already spending on ads. The money moved from rented clicks to owned rankings.
That trade is the position we defend on every ecommerce account. Organic search is not a cost line next to paid ads. It is where the ad budget goes once the pages rank well enough to earn the clicks without paying for them, and getting them to rank is the part the method below does.
Why bathroom shoppers search before they buy
Bathroom buyers research harder than most shoppers because a shower or a sauna is expensive, fixed in place and hard to return. That research is the opening organic search fills. Before a homeowner buys, they want to know whether a walk-in shower fits the room, what a home sauna needs in space and power supply, how installation works, and what delivery looks like for a heavy item.
Each of those questions is a search, and each search is a chance to be the page that answers it. An ad can appear above those searches, but it rarely answers them. A buying guide, a comparison or a well built category page does, and the shopper who gets the answer from the store tends to come back to buy from it. That is the pattern behind the returning user figures further down this page.
The semantic SEO method behind the numbers
The organic side was built with semantic SEO, which means organising the whole site around the store’s central entity, its shower and sauna range, so Google understands what the store sells and which page answers which search. The semantic SEO and topical authority programme at True SEO Consultants Ltd runs the same way on every site, and on this store it covered four layers: the topical map, the collection pages, the product pages and the AI citation work.
The topical map for a bathroom store
A topical map is the plan of every topic the store must cover, and which page covers it, drawn up before any page is rewritten. For this retailer the central entity is the shower and sauna range, the core section is the collection and product pages that sell, and the outer section is the guides, comparisons and planning advice that answer questions before a purchase.
We built the store’s map from three sources: Search Console queries, the product feed attributes and the questions competitors already answer. Each attribute of the range, such as size, fitting type, material, power supply and price band, was given one owner page. That stops two pages competing for the same search. Our guide to how to create a topical map shows the same method step by step with a worked example.
The map decided three things that changed the numbers:
- Which collections deserved their own page and which belonged as a filter or a heading on a parent collection.
- Which guides fed which collections, so every informational page passed its relevance to a page that sells.
- Where internal links went, from guides up to collections and from collections down to their best products.
Collection page optimisation
Collection pages, Shopify’s name for category pages, were rebuilt to answer the buyer’s question before showing the grid, because they answer the commercial searches typed by people ready to buy. Each one now opens with a short answer-first introduction naming what the collection contains and who it suits. Products come next. A buying guide sits lower down, where the shopper who is still comparing will scroll to it.
The work on each collection followed the same checklist:
- Unique introduction of two to four sentences, written from the attribute map, not from a template.
- Comparison table of the main product types in the collection, with the attributes shoppers filter by.
- Buying guide block below the grid, answering the three to five questions the collection’s searches ask.
- Controlled filters, so size, finish and price filters cannot create indexable duplicate URLs.
- Links out to the guides that explain the collection and to the sub-collections beneath it.
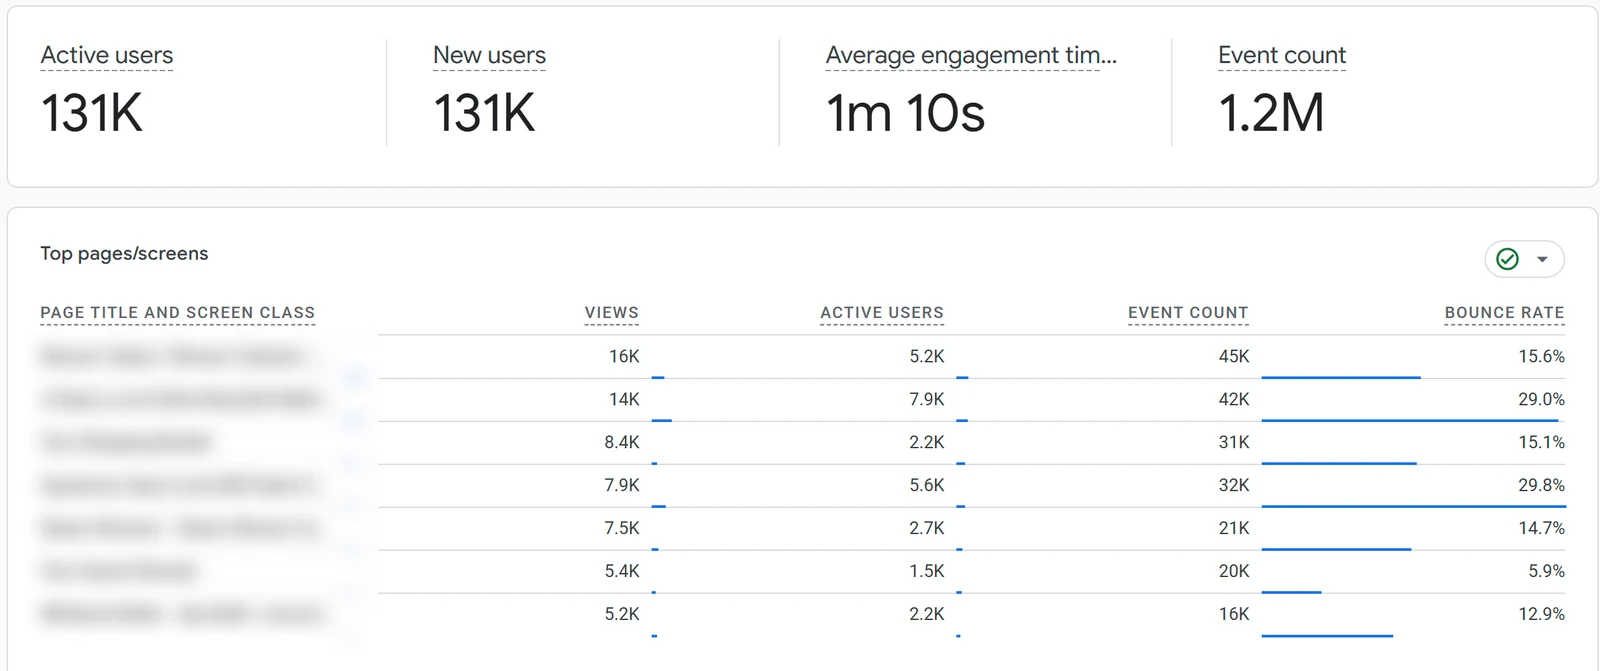
In the window, the seven busiest pages show bounce rates between 5.9% and 29.8%, and the busiest page drew about 16K views from about 5.2K active users with a 15.6% bounce rate.
Product page optimisation
Product pages were rewritten so that each one states facts a shopper and a search engine can both use, instead of repeating the manufacturer’s description found on dozens of other sites. Duplicate manufacturer copy gives Google no reason to rank one store’s page above every other store carrying the same text.
Each product page now carries:
- An original description built from the product’s attributes and the questions buyers ask about it.
- A specification table with the attributes in the same order as the collection filters.
- Product FAQs drawn from customer service questions and Search Console queries.
- Product structured data with price and availability, plus review data where the store collects reviews. Google’s product structured data documentation says this markup can show price, availability, review ratings, shipping and returns information in search results.
- Descriptive image names and alt text that describe what each photograph shows.
Organic Shopping shows the strongest result of the five channels in the session report. Google’s free listings, which Google Merchant Center help describes as appearing at no cost across Search, the Shopping tab, Images, Lens and YouTube, brought in 2,787 users and £20,317 of revenue at a 4.81% key event rate, the best conversion rate of the five.
What changes when the store runs on Shopify
Shopify handles part of the technical layer for you, which moves the work onto content and structure. Shopify’s help centre says every store automatically generates its sitemap.xml and robots.txt files and adds canonical tags to prevent duplicate content appearing in search results. What Shopify cannot decide is which collection owns which search, what each collection says above the grid, or how guides link to the pages that sell. That is where the hours went on this store, alongside the product feed that powers the free Shopping listings. Our Shopify SEO service for Shopify, WooCommerce and Shopwired stores runs the same checklist.
AI and LLM citation work
AI assistants cite a store when its product facts are clear, consistent and repeated across the web. So the AI work was about being easy to quote. We ran it alongside the SEO as part of our AI and LLM search optimisation service, which gets a brand named when shoppers ask an assistant which product to buy.
The work had four parts:
- Consistent entity facts. The store’s name, range, delivery terms and returns policy read the same on the site, the Merchant Center feed and the main directories.
- Extractable answers. Guides and collection buying blocks open each section with a one sentence answer an assistant can lift.
- Question coverage. We covered the follow-up questions assistants generate for a product search, the pattern we explain in our piece on how query fan-out decides which pages an AI answer draws on.
- Manual measurement. Much AI traffic lands as Direct, so True SEO Consultants Ltd tests a fixed set of buying prompts in the main assistants each month and logs whether the store is named.
The step by step method, in the order we ran it
The method runs in ten steps, and the order matters more than any single step. Every stage below is standard in our ecommerce work, and on this store they ran in this order.
- Crawl the store and list every URL, its index status and its duplicates.
- Map demand to the catalogue, matching Search Console queries and paid search terms to collections and products.
- Build the topical map, with one owner page per attribute and a clear core and outer section.
- Fix the collection architecture, merging thin collections and controlling filter URLs.
- Rewrite the collection pages with answer-first introductions, comparison tables and buying guides.
- Rewrite the product pages from attributes, with specifications, FAQs and structured data.
- Publish the outer section guides, each linking up to the collection it supports.
- Clean the technical layer, covering page speed, out of stock handling and crawl waste.
- Strengthen the product feed so Organic Shopping listings carry full, accurate attributes.
- Rebalance paid spend once organic rankings held, starting with the overlapping queries.
True SEO Consultants Ltd runs all ten steps through remote digital onboarding and delivery. Competitor research sat underneath steps 2 and 3. Our guide to competitor keyword analysis for finding the searches rivals win that you do not covers that part in detail.
What the engagement data says about content quality
The engagement data shows people reading, comparing and coming back, which is what good collection and product content should produce. Across the store, visitors spent an average of 1 minute 10 seconds engaged and triggered 1.2 million events in the window.
Three figures stand out:
- Organic Search sessions average 8.11 events, the highest of the five channels shown, which means more product views, filter clicks and basket actions per visit.
- Returning users are 11.45% of users but carry £266,209.85 of revenue, about 67% of the £395,073 total, with sessions averaging 5 minutes 4 seconds.
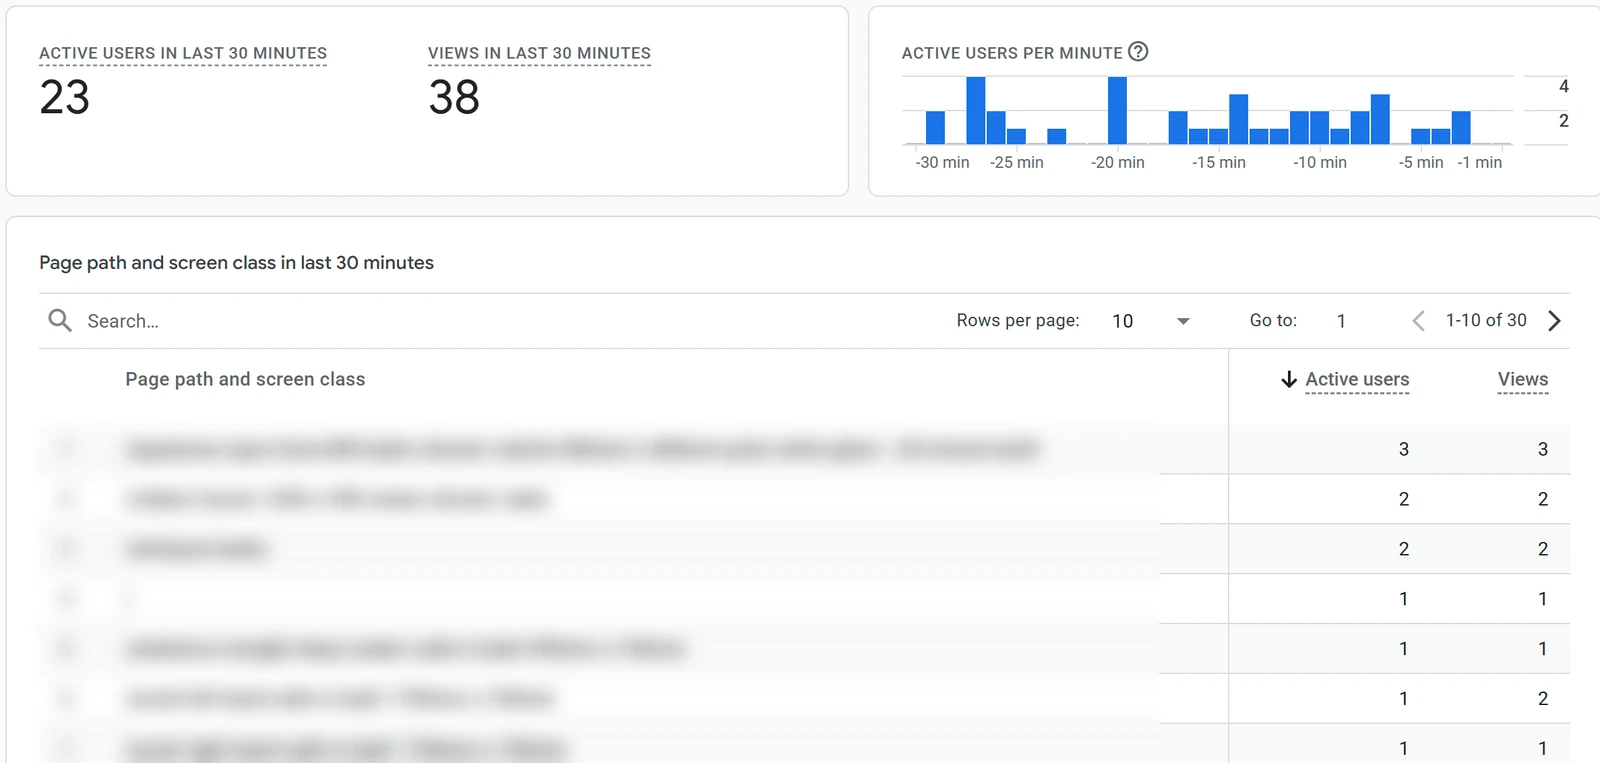
- The store was busy at the moment of capture. The realtime report showed 23 active users and 38 page views in 30 minutes, spread across 30 different pages.
The returning user figure matters most for a bathroom store. A homeowner who plans a shower or sauna project over weeks finds the store through a helpful guide, leaves, and comes back to buy, often by typing the name, which is one more reason Direct belongs in the earned conversation.
What this data proves, and where it stops
This evidence proves the earned and paid split, the conversion gap and the revenue by channel for one GA4 window. It does not prove three other things, and we would rather say so plainly than let a reader find out later from their own analytics.
- There is no before period on screen. The £5,000 to £1,250 budget change and the six month timeline are the owner’s figures, not something these screenshots show.
- Key events are not all purchases. GA4 key events are the actions the store chose to track, which usually include purchases and can include add to basket.
- Attribution is GA4’s own model. Revenue by session channel credits the session in which the sale happened, so a shopper who first found the store organically and later bought through an ad counts as paid.
That last point cuts both ways. The first user view credits the same shopper to organic search, which is why we report both views side by side.
Should an online store switch Google Ads off completely?
No, and this case shows why. Cross-network still brought in £167,148 of revenue in the window, 42% of the total, on what the owner reports is a far smaller budget than before.
The right question is which searches you should stop paying for. Paying for clicks on searches you already win in the top three organic positions is where most of the waste sits, and that is where this store’s budget came from. Launches, seasonal lines and new audiences still justify paid spend until organic pages exist for them.
A worked sum shows the trade. A store paying 60p a click for 5,000 clicks a month on queries where it already ranks first organically spends £3,000 a month for traffic it would largely get anyway. Moving half of that budget into collection and product content that ranks for new queries turns a monthly cost into a lasting asset.
Which stores does this approach suit?
This approach suits any store with a real product range, steady search demand and a Google Ads bill that has crept up year on year. It fits best where buyers research before they spend, which is why bathroom and home improvement retail responds so well:
- Bathroom, shower and sauna retailers, where planning questions about space, fitting and power supply drive the searches.
- Kitchens, flooring and tiles, where measurements and comparisons decide high value orders.
- Hot tubs, garden rooms and outdoor living, where buying guides do the selling before the basket.
- Car parts and accessories, where compatibility attributes decide which page a search lands on.
- Luxury and heritage goods, where trust signals and provenance content convert browsers.
The platform matters less than the structure, and the location matters even less: remote digital onboarding and delivery means a store in Belfast gets the same process as one in Cardiff. Our ecommerce SEO consultancy for online stores covers every platform, and our earlier ecommerce SEO case study shows what the same approach did for a Shopwired store in three months.
Frequently asked questions
Can SEO replace Google Ads for an online store?
SEO can replace most of the paid clicks a store buys on searches it already ranks for, but not all paid activity. Launch campaigns still need ads. This store cut its ad budget by about 75% and kept its Cross-network campaigns for launches and new audiences.
How long does it take for organic search to reduce ad spend?
This store saw the budget move over six months, and the owner reports the full 75% cut within that period. Budget comes out query by query, once the organic pages hold top three positions for the searches the ads had been buying.
Is Shopify good for SEO?
Shopify is a sound base for SEO because it generates the sitemap, robots.txt and canonical tags automatically. The ranking work still sits with the store: collection content, product descriptions, internal links and the product feed.
Should a bathroom retailer run SEO and Google Ads together?
Yes, with the budget aimed at different jobs. Organic pages answer the planning searches homeowners make for weeks before they buy, while ads cover launches, seasonal lines and searches the store does not rank for yet.
Is Direct traffic organic?
Direct traffic is unpaid but not organic search. It includes typed visits, bookmarks and visits from apps that strip the referrer, such as many AI assistant apps, and some of it comes from people who first met the store through an ad.
Why is Cross-network counted as paid?
Cross-network is paid because it is Google Ads traffic. GA4 uses the label for Performance Max and Demand Gen campaigns, which run across several Google networks at once.
How do I check my own earned versus paid split?
Open GA4, go to User acquisition, set the report to First user primary channel group and add up the Organic, Direct and Paid rows. Then open Traffic acquisition to see revenue and key event rate by session channel.
Want this for your store?
True SEO Consultants Ltd builds organic search that pays for itself by replacing ad spend, and every figure on this page came from the client’s own GA4. True SEO Consultants Ltd works from Startup Stiwdio, University of South Wales, 86-88 Adam Street, Cardiff, CF24 2FN, and serves online stores across the UK through remote digital onboarding and delivery, so the work above applies whether your warehouse is in Cardiff, Leeds or Glasgow.
Start with a free 30 minute strategy call. We’ll pull your earned and paid split from GA4, find the searches you are paying for twice, and show you what the budget could do instead. Book your free ecommerce SEO audit with True SEO Consultants Ltd.